


The Atlanta Real Estate Report is a podcast & companion website for those interested in the Atlanta real estate market. This includes individual buyers, sellers and investors. It also includes architects, builders, developers, lenders, realtors and urban planners; anyone working in or supporting the local real estate ecosystem.
NEW » In addition to the Substack app, this podcast is available on Spotify and Apple Podcast.
PRO TIP » The text portion of this podcast contains dozens of hyperlinks, charts and graphs that are integral to the discussion. If you can have that open (preferrably on a desktop computer) while listening to the audio portion, you will get A LOT more out of it.
In this episode, we will…
Consider how and where Wall Street and Main Street meet
Discuss the benefits of understanding this dynamic intersection
Look at some publicly-traded companies in the housing sector
Explore how these Wall Street companies impact Main Street
Learn what we can glean from stock charts and earnings announcements
Take a sip from the Wall Street “fire hydrant”
Future Episodes…
Looking Ahead to 2023…
Institutional Investors: Who are they, and how do they impact the housing market?
Real Estate Investment Trusts (REITs)
Resources: Newsletters + Podcasts + YouTube channels
Let’s start with some definitions…

For the purposes of this discussion, the term “Wall Street” refers to the capital markets, in general, but especially equities. Our primary focus will be on publicly-traded companies in the real estate sector. The term, “Main Street” refers to economic activity, both at the local and national level. It also refers to us, as contributors to and beneficiaries of that econmic activity.

“When it comes to real estate, there are two ways we can benefit by understanding the relationship that exists between Wall Street and Main Street. The first lies in our ability to build equity by becoming owners in some of the most dynamic companies in the world. That is, to participate in the growth of this industry in ways that go beyond owning property directly. The second relates to the insights we can gain from the regular (required) reporting of the financial performance of these companies.”
Publicly Traded Companies: A Primer
What defines a “public” company?
They go from private to public via an Initial Public Offering (IPO)
Business and financial information disclosed to the public on a regular basis
Ways to invest in publicly traded companies
Stocks = Equity = Owner = Wealth Creation
Bonds = Debt = Creditor = Income Generation
Derivitives (options & futures) — hedging, speculation and income generation
Investing vs. Trading (own vs rent; local vs tourist)
Many people own public companies directly in the form of individual stocks and/or participate indirectly via ETFs, mutual funds and 401k plans
Typically, larger than private companies
Regional, national or international footprint
Private companies tend to be local, especially in the residential RE space
Continuous and real time “price discovery” while the markets are open
Subtle but important point
Makes them highly liquid
Contrast this to direct ownership of real property
Highly efficient vs highly inefficient pricing (objective vs subjective)
This is the key difference between stocks and real property!
Stock prices are a leading indicator of…
Economic activity at the index level (DJIA, S&P 500, etc.)
Industry trends at the industry level (banks, home builders, etc.)
A company’s outlook at the stock-specific level
Let’s look at a few charts to gain some perspective…
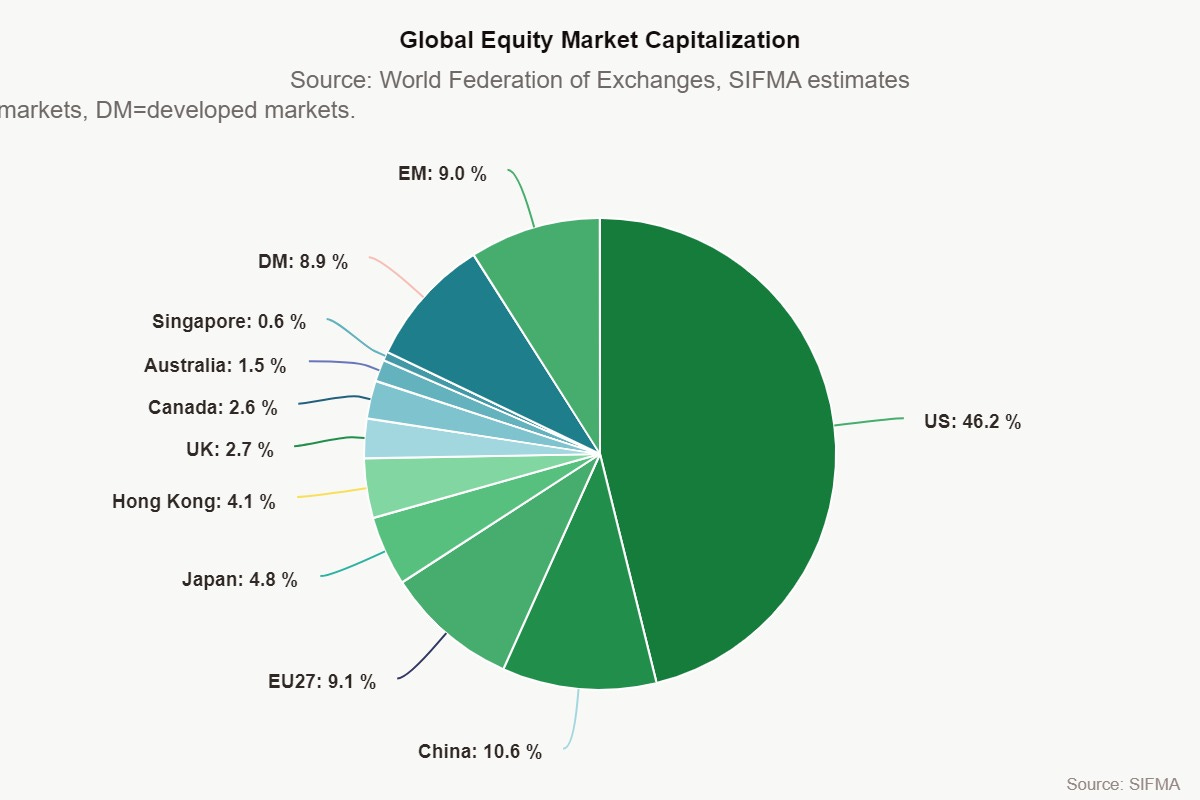
The sheer size of the equity markets makes them a powerful force when it comes to their economic impact on Main Street…
> > > Click on the images below to enlarge the charts…

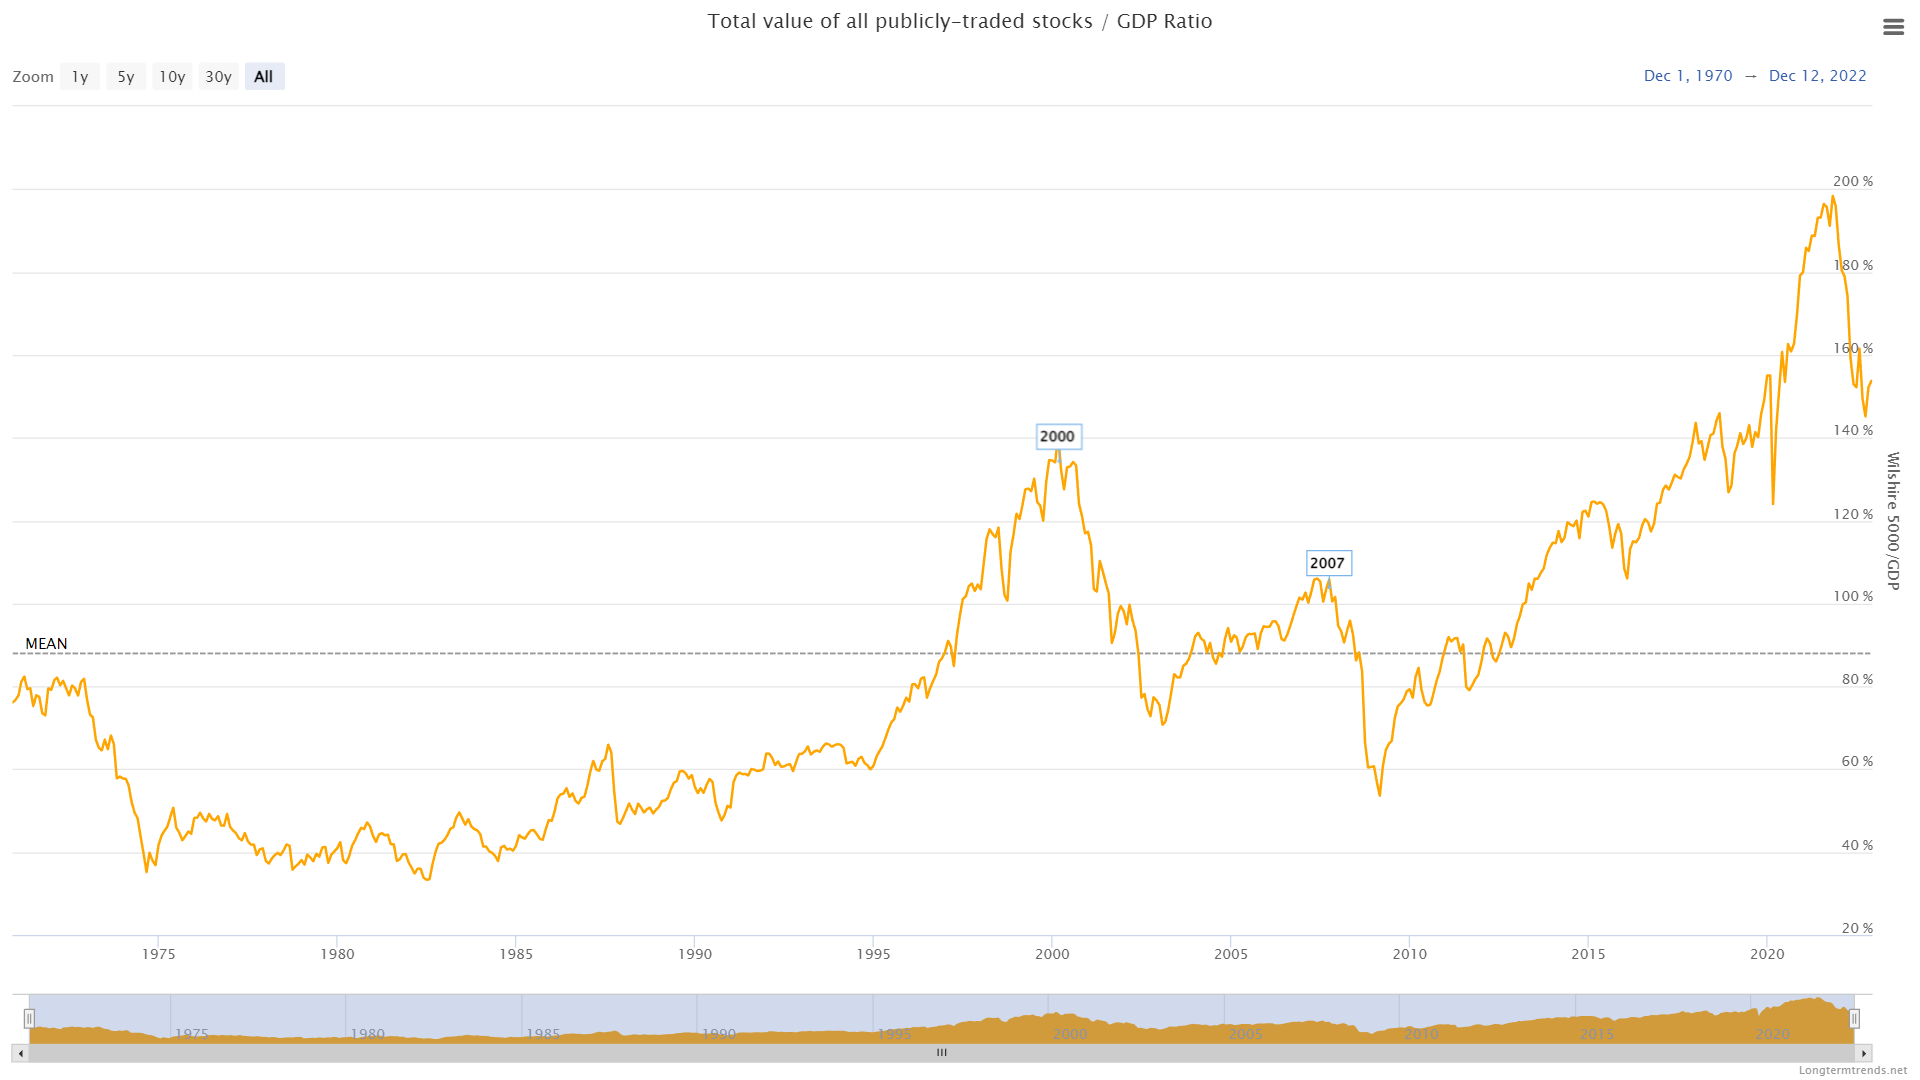
In the chart above, note the move from the GFC low in 2009 to the pandemic high of late 2021. Equity market cap rose from about 50% to almost 200% of GDP. That is one heck of a run!
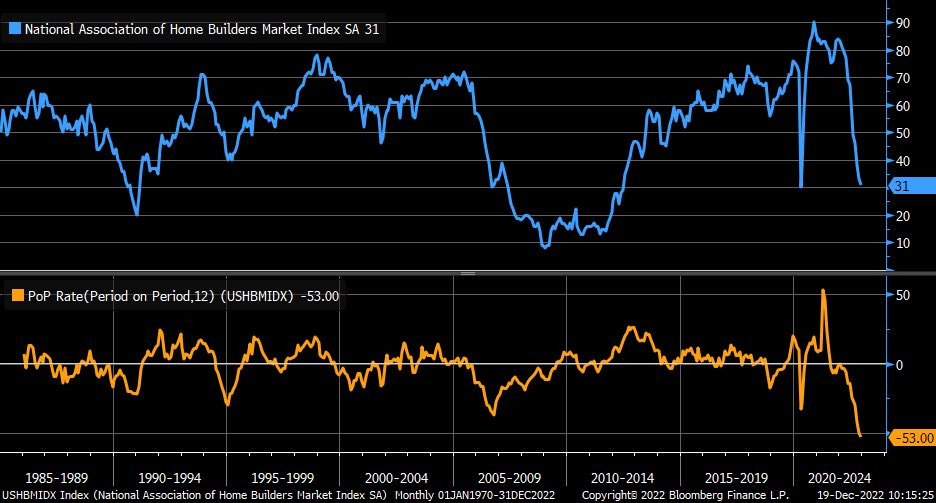
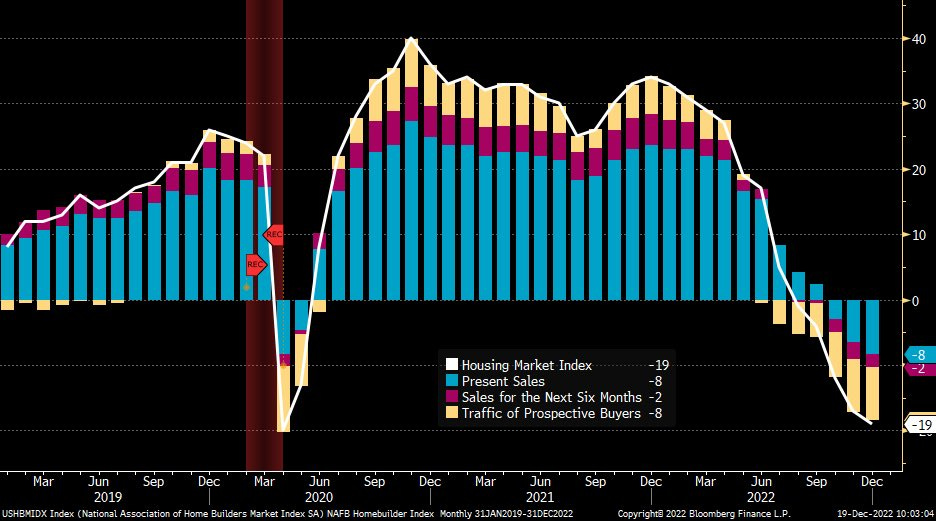
Stock prices and the business cycle…

Stock prices and building permits are leading indicators…

Let’s look at some publicly-traded companies* in the housing sector…
Disclaimer: All of the information below has been provided for educational purposes only. I am not a financial advisor and nothing in this podcast / newsletter should be construed as investment advice. If you decide to invest based on anything you hear or read here, you MUST do your own research and seek the advice of a financial professional BEFORE doing so. Thank you.
Publicly-traded companies are the “fulcrum” between Wall Street and Main Street. They allow us to participate in the long-term growth of the real estate industry with a much lower investment than owning real property directly — and, in the case of rental property, with less headaches. They also allow us to focus our investment capital on very specific sectors and segments of the industry.
> > > Click on the company names below to access their investor relations pages…
Home Builders — DR Horton + Century Communities + Lennar + Pulte Group + Meritage + Taylor Morrison + Green Brick Partners + Toll Brothers + Beazer + LGI
Banks — Truist + Bank of America + Wells Fargo + Synovus + Ameris + United Community + JP Morgan Chase + Regions + South State + OZK
Mortgage — Rocket + United Wholesale + Loan Depot
Residential Brokerage — Anywhere + Berkshire Hathaway + Compass + + RE/MAX
iBuyers & Hybrids — eXp + Offerpad + Opendoor + Redfin + Zillow
Single-Family Home Rental — American Homes 4 Rent + Invitation Homes
Commercial — CBRE + Cushman & Wakefield + JLL + Colliers
Building Supplies — A.O. Smith + Carrier + Owens Corning + Home Depot + Mohawk Industries + Sherwin Williams
Home Furnishings — RH + Sonos + Lazy Boy + Sealy + Wayfair + Williams-Sonoma
Exchange Traded Funds (ETFs) — SPDR® S&P® Homebuilders ETF + iShares U.S. Home Construction ETF + Invesco Dynamic Building & Construction ETF + Hoya Capital Housing ETF
Real Estate Investment Trusts (REITs) — Separate topic / future episode
Public REITs own 535,000 properties across the U.S. as of year-end 2020.
Equity and mortgage REITs combined own roughly $3 trillion in gross real estate assets.
Private REITs own an additional $1.5 trillion in gross assets bringing the total REIT ownership value to $4.5 trillion in the U.S. as of year-end 2021.
U.S. REITs contributed the equivalent of an estimated 3.2 million full-time jobs to the economy in 2021 generating $229 billion of labor income.
REIT activities resulted in the distribution of $92.3 billion of dividend income in 2021.
Source: Nareit
NOTES:
Keep in mind that this a small sample of the PUBLIC companies that operate in the real estate industry. As such, they are some of the largest in their respective categories. These are HUGE companies. There are also thousands of PRIVATE companies (typically much smaller) that also contribute greatly to the real estate economy, especially in the way of builders, brokerage companies and mortgage companies.
Clicking on the company names will take you to their investor relations pages. Look for press releases, investor presentations, conference calls and webcasts.
The names listed under “Home Builders” and “Banks” are the Top 10 publicly traded companies operating in the Atlanta region for their respective categories. Note that these rankings may change from year to year.
The real estate “ecosystem” is dynamic and really interesting…
> > > Click on the images below to enlarge the charts…


What can we glean from stock price charts?
Disclaimer: All of the information below has been provided for educational purposes only. I am not a financial advisor and nothing in this podcast / newsletter should be construed as investment advice. If you decide to invest based on anything you hear or read here, you MUST do your own research and seek the advice of a financial professional BEFORE doing so. Thank you.
Within a given sub-sector, stock returns can vary significantly…
> > > Click on the images below to enlarge the charts…

“Stock price charts provide us with a portal into the past, present and future of a company, an industry or the entire economy. They are especially useful when evaluating price action over various time periods and in relation to other companies or benchmarks (i.e., relative performance). Charts enable us to understand the impact external events (shocks) such as a pandemic, recession, etc. Technical analysis of charts allows us to make informed decisions about future price action.”

Speaking of home builders…
How do these Wall Street companies impact Main Street?
Access to capital
M&A activity
Economic impact
Wealth effect
Access to Capital
By tapping equity & debt markets
Use for expansion, R&D (innovation)


Going public in a bear market…

Timing is everything…

Mergers & Acquisitions
Public + private combos create a liquidity event at the local level (e.g., Green Brick + Providence Group, 2011)
Public + public combos seek to create diversification, scale and/or synergy (e.g., Home Depot + HD Supply, 2020) — MRO (Maintenance, Repair, and Operations)
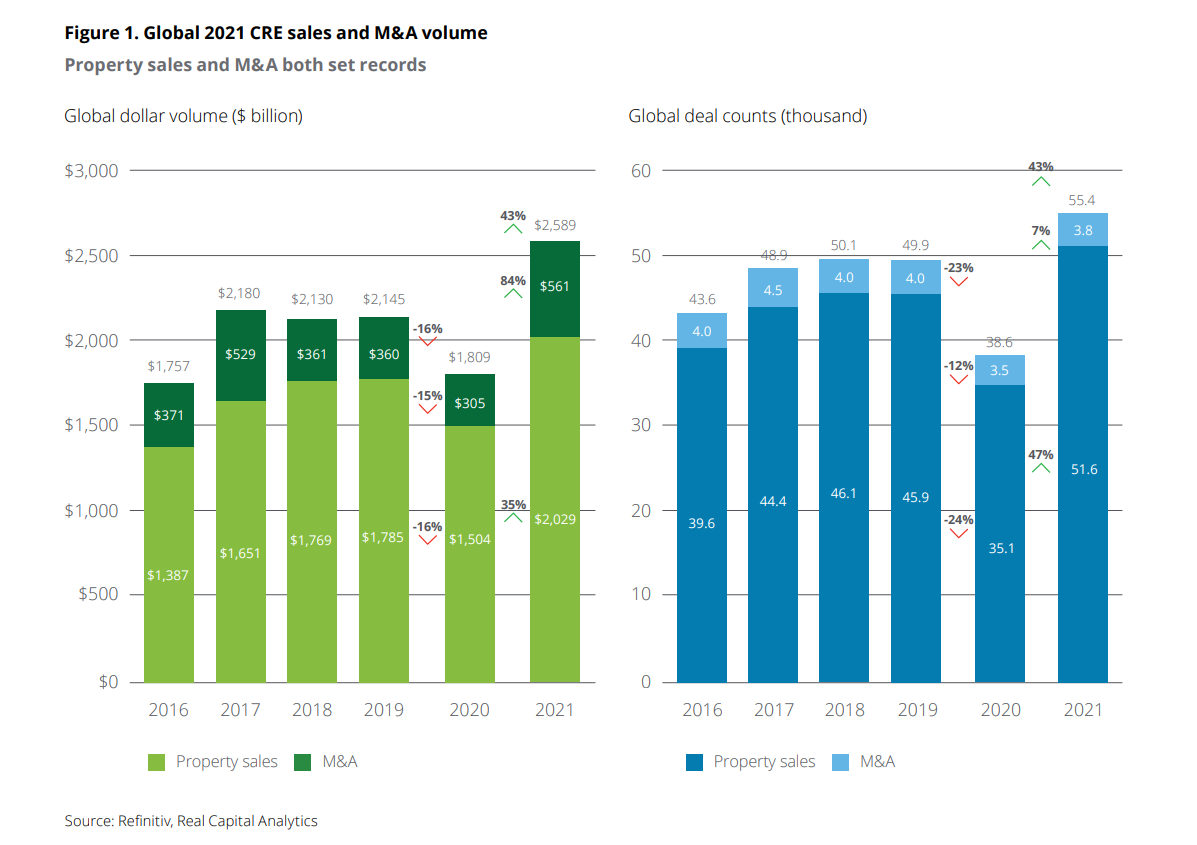
Especially significant in CRE market (size)
Primarily REITs and public companies like Blackstone and Blackrock
Private equity, pension funds and foreign investors
Economic Impact
Huge multiplier effect
Residential Housing: 15-18% of GDP ($3.9 - 4.7 trillion) + 33% of consumer spending (Source: NAHP + Hoya Capital)
Commercial Real Estate: $1.2 trillion in GDP + $418.7 billion in salaries and wages (Source: NAIOP)
Commercial Real Estate: 8.5 million jobs
Construction employment = 7.6 million jobs (3.1M residential)
Construction jobs: ~300,000 to 400,000 per month
NOTE: Economic impact and employment data are for the entire real estate industry, which includes both public and private companies

Wealth Effect
Equities = ownership = wealth creation
Bear markets lead to wealth destruction which, in turn, can lead to demand destruction (including real estate and related sub-sectors)
Stock prices affect consumer confidence which, in turn, impacts consumer spending
Most 401(k) plans invest in stocks


Taking a sip from the Wall Street “fire hydrant”
Earnings announcements
Impact
Announcements impacts stock prices in the short term
EPS growth rate (predictablity and sustainability) impacts price in the longer term
Investors focus on…
Reported vs Expected (Concensus) — by “The Street”
Guidance — provided to Wall St analysts by company management
Financial Statements
Quarterly
Annual
Investor Relations
Earnings Calls (live + recorded)
Investor Presentations
Research Reports
Wall Street Analysts
Company and industry / sector specific
Strategy (asset allocation, market outlooks, etc.)
Economic forecasts (consumer spending, etc.)
Thematic (innovation, etc.)
Company-sponsored content
Third-party (Market Watch, Seeking Alpha, etc.)
Financial journalism
Barron’s, Bloomberg, CNBC, Financial Times, Forbes, Fortune, Wall Street Journal, etc.
Free vs. subscription-based
Bloggers, vloggers & podcasters
Social media
Twitter — preferred platform for journalists
YouTube — long-form content; interviews


