This segment first appeared in the 12/30/22 episode of the Atlanta Real Estate Report…
Let’s look at a few charts to gain some perspective…
The sheer size of the equity markets makes them a powerful force when it comes to their economic impact on Main Street…
> > > Click on the images below to enlarge the charts…
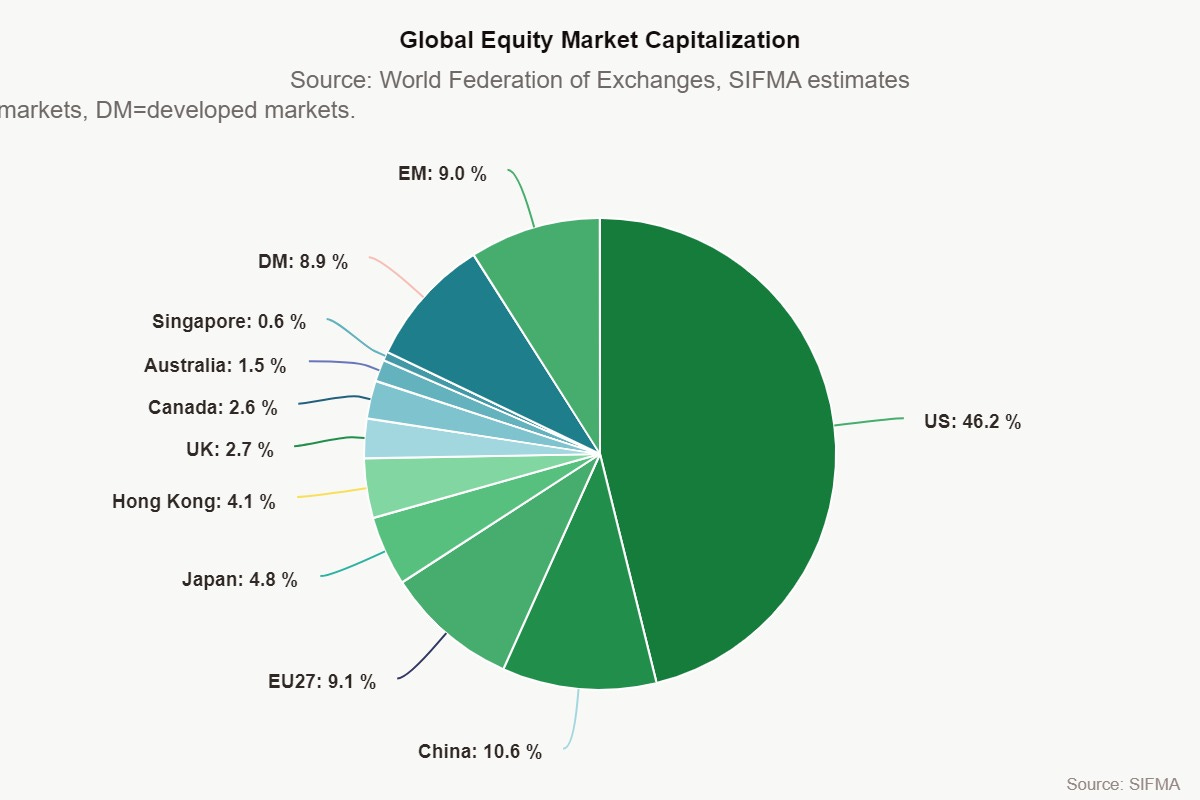
The U.S. equity markets are the largest in the world and continue to be among the deepest, most liquid and most efficient, representing 46.2% of the $111 trillion global equity market cap, or $51 trillion. This is 4.3x the next largest market, China. U.S. market share has averaged 37.4% over the last 10 years, troughing at 32.9% in 2012 and peaking at 46.2% as of 3Q22. Source: Securities Industry and Financial Markets Association — Chart provided for educational purposes only
$25.7 trillion — 50-year chart of U.S. GDP. GDP serves as a gauge of our economy’s overall size and health. GDP measures the total market value (gross) of all U.S. (domestic) goods and services produced (product) in a given year. Source: Federal Reserve Bank of St. Louis
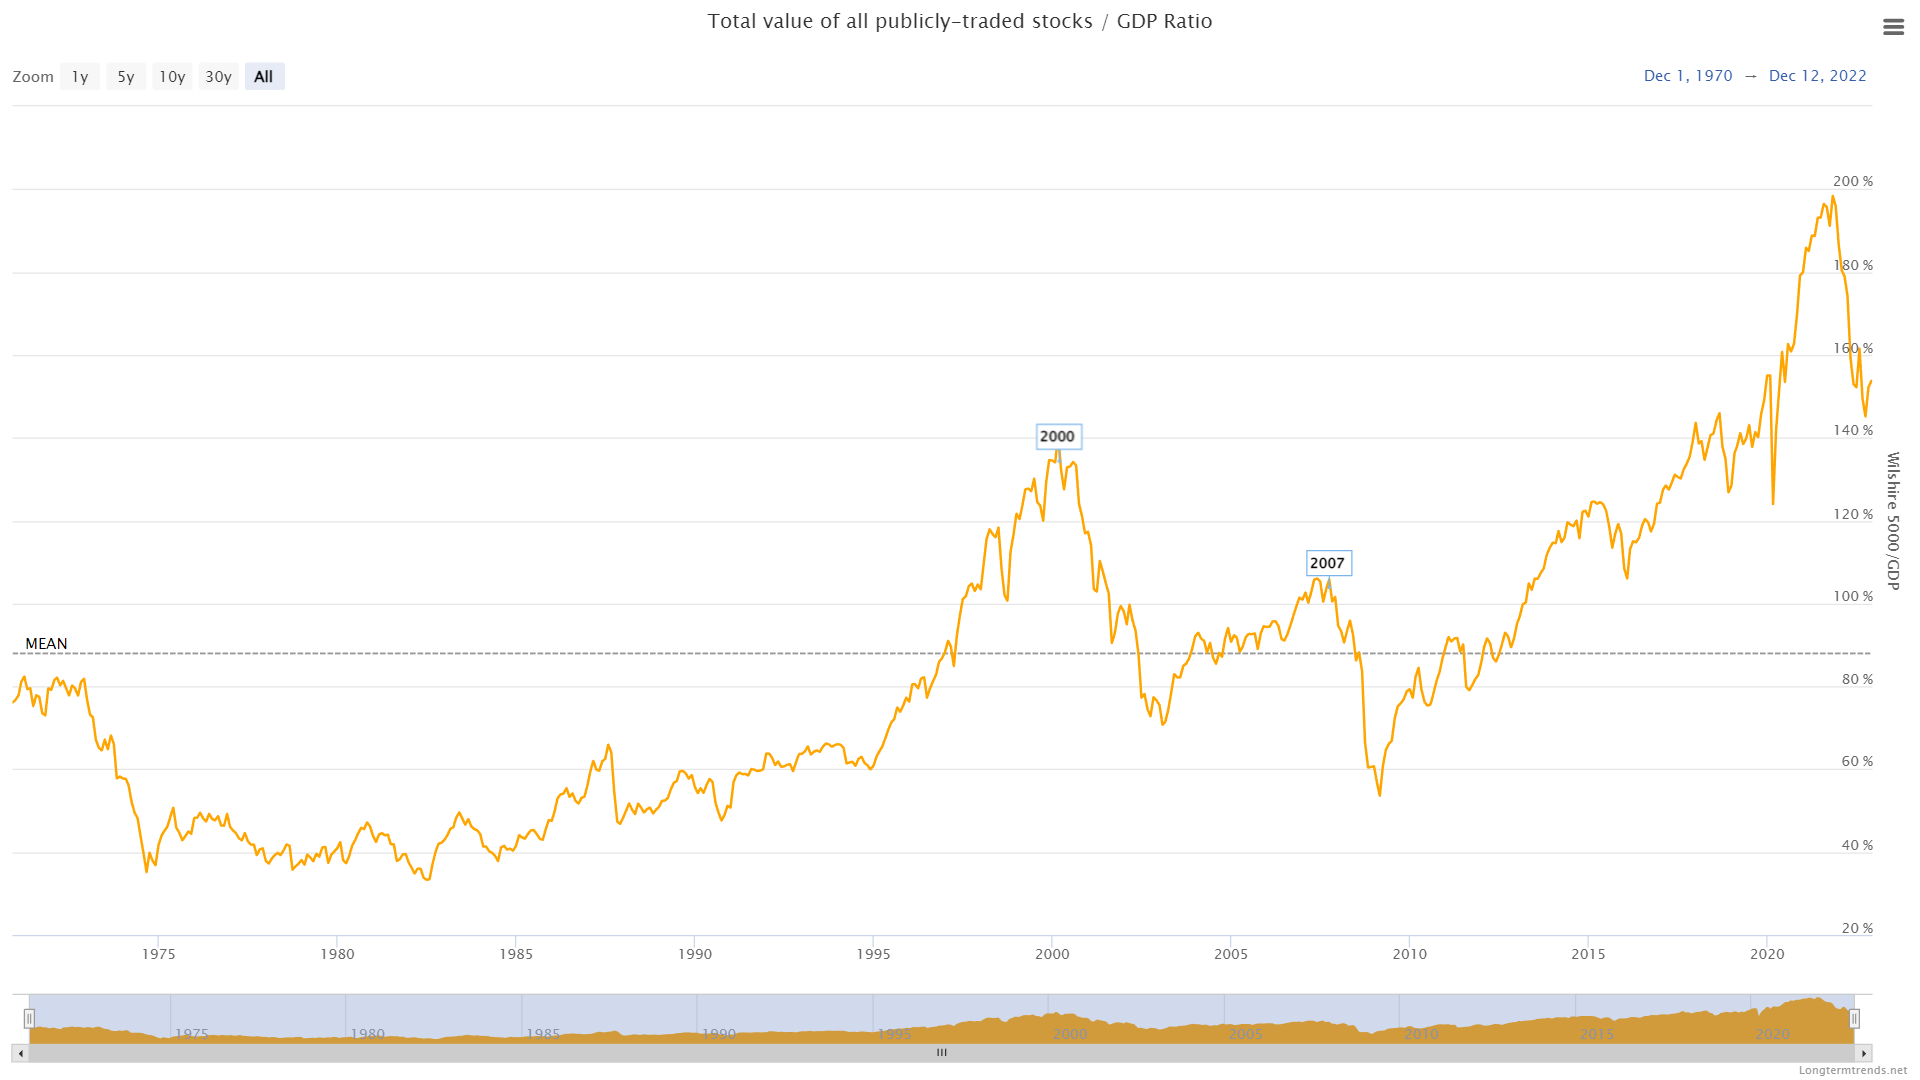
Current: 150% — Market Cap to GDP is a long-term valuation indicator for stocks. It has become popular in recent years, thanks to Warren Buffett. Back in 2001 he remarked in a Fortune Magazine interview that "it is probably the best single measure of where valuations stand at any given moment." Source: LongTermTrends.com — Chart provided for educational purposes only
In the chart above, note the move from the GFC low in 2009 to the pandemic high of late 2021. Equity market cap rose from about 50% to almost 200% of GDP. That is one heck of a run!
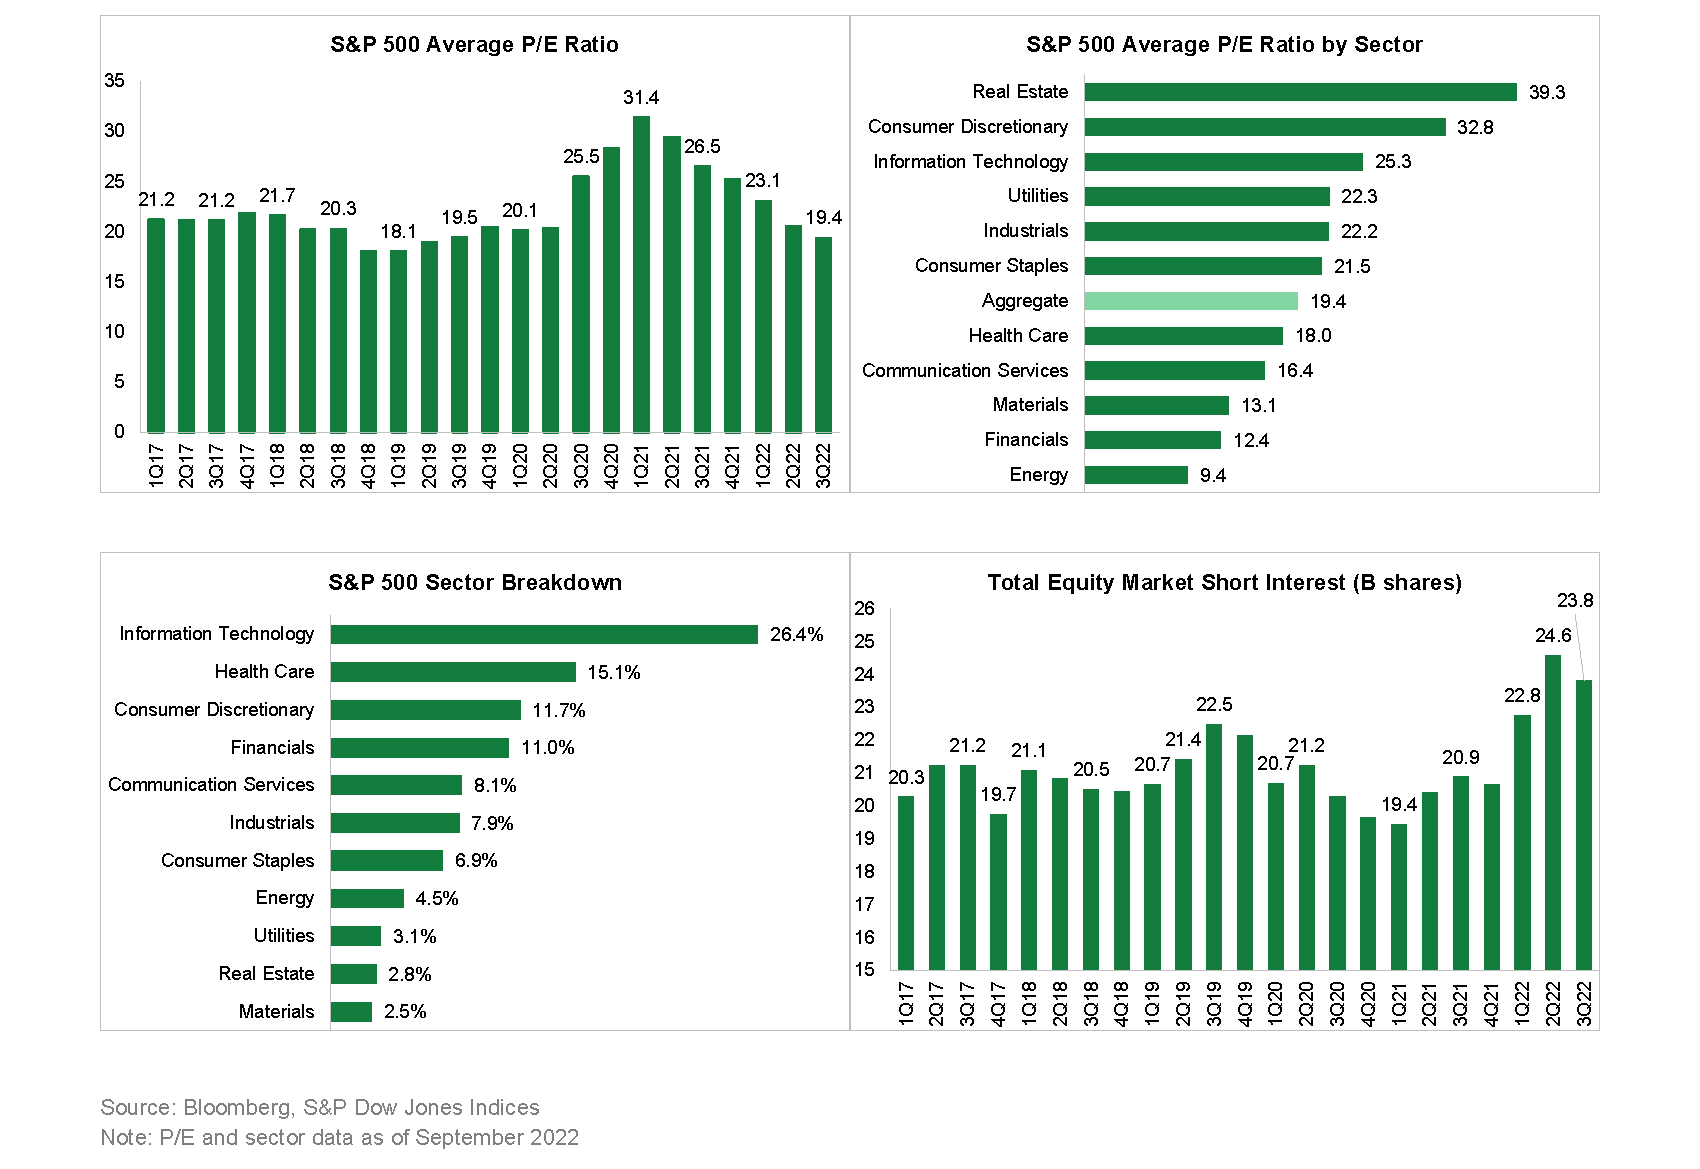
Note the relatively high valuations of the real estate sector (P/E=39.3) and the relatively low share of S&P500 (2.8%). P/E and sector data as of Sept 2022. These values change constantly and may be very different when you view this chart. Source: SIFMA Research Quarterlies, 3Q/2022 — Chart provided for educational purposes only
Stock prices and the business cycle…
The stock market and the economy look in different directions. The stock market is forward looking. The price you are willing to pay for a stock today is based on how well you and other investors expect the company to do in the future. By contrast, some economic data looks back at what has already happened. For example, employment numbers show how many people are actively out of work. This indicator tends to lag the broader economy because businesses often react to how the economy is faring when they make hiring and layoff decisions. The forward-looking nature of the stock market tends to mean it often leads the economic cycle, as seen in the chart below. Source: RBC Global Asset Management
Stock prices and building permits are leading indicators…
The US LEI fell sharply in November, continuing the slide it’s been on for most of 2022 after peaking in February. Only stock prices contributed positively to the US LEI in November. Labor market, manufacturing, and housing indicators all weakened, reflecting serious headwinds to economic growth. Interest rate spread and manufacturing new orders components were essentially unchanged in November, confirming a lack of economic growth momentum in the near term. Source: The Conference Board
Atlanta Real Estate Report by ATLsherpa is a reader-supported publication. To receive new posts and support my work, consider becoming a free or paid subscriber.