Atlanta Real Estate Report
Atlanta Real Estate Report Podcast
How Public Companies Impact Main Street
0:00
-46:15

How Public Companies Impact Main Street

Wall Street Meets Main Street, Part 4

This segment first appeared in the 12/30/22 episode of the Atlanta Real Estate Report…

How do these Wall Street companies impact Main Street?

  1. Access to capital

  2. M&A activity

  3. Economic impact

  4. Wealth effect

Access to Capital

  • By tapping equity & debt markets

  • Use for expansion, R&D (innovation)

Source: SIFMA Research Quarterlies, 3Q/2022 — Chart provided for educational purposes only

Going public in a bear market…

3-year stock price chart for Compass, Open Door, DR Horton, Home Depot vs S&P500. OPEN went public on 12/21/20 @ $29.50/share. COMP went public on 4/1/22 @ $18/share. As of 12/19/22, OPEN was trading at $1.32/share and COMP was trading at $2.44/share. — Chart provided for educational purposes only

Timing is everything…

5-year chart of SPY (S&P500 ETF). The goal of investment bankers is to maximize the amount of capital derived by their clients from a liquidity event (e.g., IPO). How did they do on the OPEN and COMP deals? — Chart provided for educational purposes only

Mergers & Acquisitions

  • Public + private combos create a liquidity event at the local level (e.g., Green Brick + Providence Group, 2011)

  • Public + public combos seek to create diversification, scale and/or synergy (e.g., Home Depot + HD Supply, 2020) — MRO (Maintenance, Repair, and Operations)

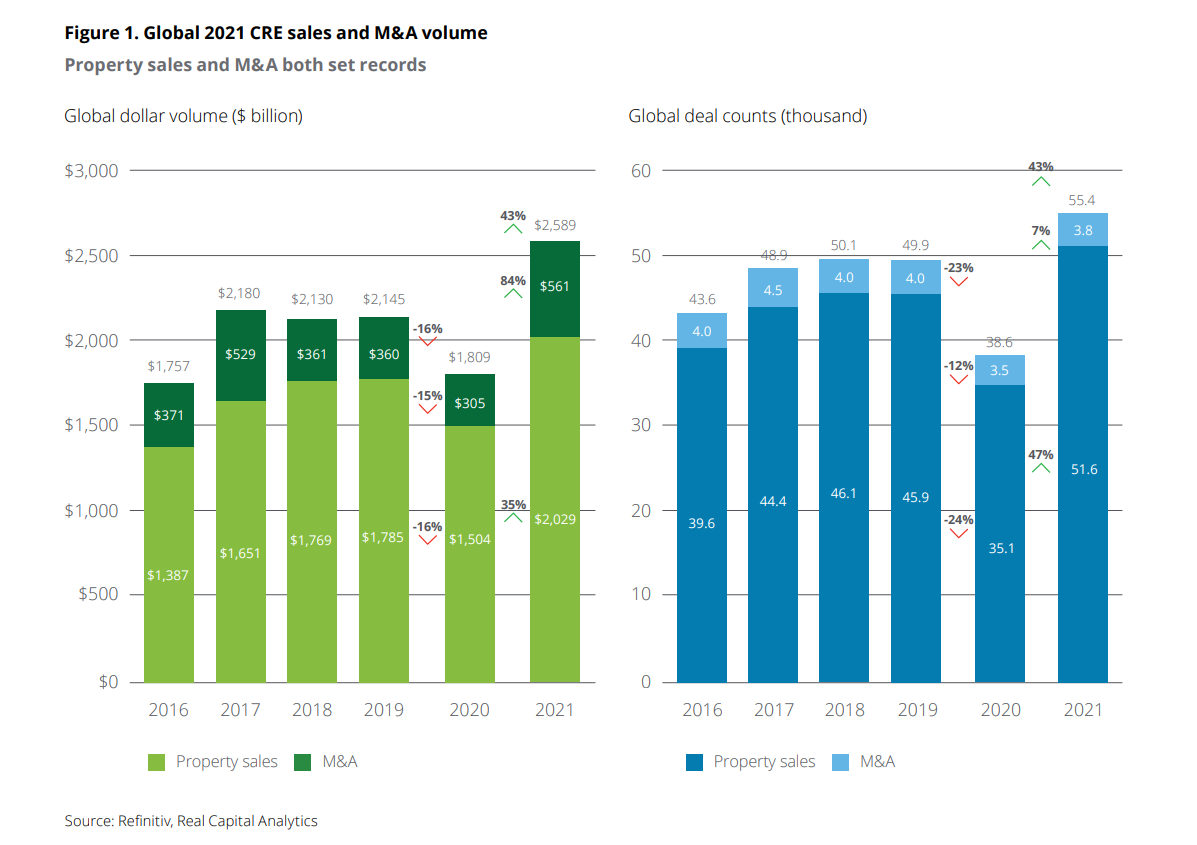
  • Especially significant in CRE market (size)

    • Primarily REITs and public companies like Blackstone and Blackrock

    • Private equity, pension funds and foreign investors

2021 Global CRE Sales + M&A Volume — Source: Deloitte

Economic Impact

  • Huge multiplier effect

  • Residential Housing: 15-18% of GDP ($3.9 - 4.7 trillion) + 33% of consumer spending (Source: NAHP + Hoya Capital)

  • Commercial Real Estate: $1.2 trillion in GDP + $418.7 billion in salaries and wages (Source: NAIOP)

  • Commercial Real Estate: 8.5 million jobs

  • Construction employment = 7.6 million jobs (3.1M residential)

  • Construction jobs: ~300,000 to 400,000 per month

NOTE: Economic impact and employment data are for the entire real estate industry, which includes both public and private companies

This slide shows the amount (share) of annual consumer spending represented by housing (left). It also shows the weighting of the real estate sector in the S&P 500 (right). Source: Hoya Capital — Chart provided for educational purposes only

Wealth Effect

  • Equities = ownership = wealth creation

    • Bear markets lead to wealth destruction which, in turn, can lead to demand destruction (including real estate and related sub-sectors)

  • Stock prices affect consumer confidence which, in turn, impacts consumer spending

  • Most 401(k) plans invest in stocks

$31.6 trillion — 20-year chart showing the value of corporate equities and mutual funds held by U.S. households. Source: Federal Reserve Bank of St. Louis
$29.6 trillion — 20-year chart showing real estate equity owned by U.S. households. Source: Federal Reserve Bank of St. Louis
Current 344.8 — House Price Index for Atlanta-Sandy Springs-Alpharetta, GA (MSA) INDEX = 100 (1995) — Federal Reserve Bank of St. Louis (FRED)

Share


Atlanta Real Estate Report by ATLsherpa is a reader-supported publication. To receive new posts and support my work, consider becoming a free or paid subscriber.

Get 20% off a group subscription

Give a gift subscription

Atlanta Real Estate Report
Atlanta Real Estate Report Podcast
Podcast + newsletter that explores Atlanta's dynamic real estate market